
The Algorithm That Saved Cricket
How Two Statisticians Fixed the Most Unfair Rule in Sports. A deep dive for curious minds of Duckworth and Lewis that changed cricket.

“You follow cricket. Tell me — how does Duckworth-Lewis actually work?”
TLDR; ( 3 minute story)
I’d watched hundreds of rain-affected matches. I’d cursed at revised targets. But explain it? Actually explain the math? I stumbled through an answer. And then I spent the next three hours going deep on it — because it turned out to be one of the most elegant problem-solving stories in sports. And one of the best case studies I’ve ever come across in building fair systems.
Why Cricket Is So Hard to Model
Before the solution, we need the problem. Most sports have a clock — if a match is interrupted, you pause and resume. Easy.
Cricket has two resources, not one:
Overs (time) — Each team gets 50 overs (300 balls) to bat.
Wickets (lives) — Each team has 10 batsmen. Lose all 10 and your innings ends, regardless of overs left.
These two resources interact in a non-linear way. A team with 30 overs left and 9 wickets in hand is in a completely different position from a team with 30 overs left and 3 wickets. Same time. Completely different game.
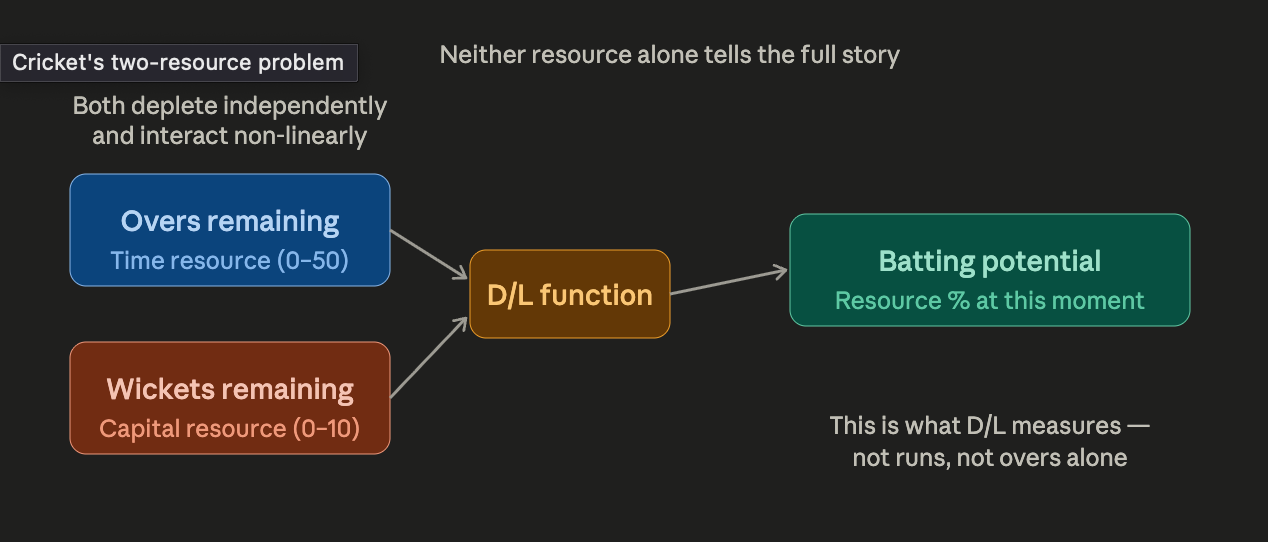
This diagram shows the two-resource structure every batting team operates within:When rain falls and overs are lost, you can’t just subtract a number from the target. You have to account for what those overs were worth, given the wicket state, given the phase of the innings, given the resources both teams had.
The Disaster That Made D/L Necessary
March 22, 1992. Sydney. World Cup Semi-Final.
England vs South Africa. England had posted 252 off 45 overs. South Africa were chasing brilliantly — with 13 balls remaining, they needed just 22 runs. Difficult but absolutely doable.
Then the rain came.

Cricket used the “Most Productive Overs” rule (MPO) at the time. The logic seemed sensible: if Team B loses n overs to rain, subtract Team A’s n lowest-scoring overs from the target. Remove the “junk” overs, give Team B a fairer chase.
Two overs were lost. Officials calculated. The new target:
South Africa needed 21 runs off 1 ball.
The crowd fell silent. South Africa were eliminated — not by the opposition, not by their own batting — but by a rule that was geometrically, mathematically catastrophic.
Here’s why MPO was so broken:
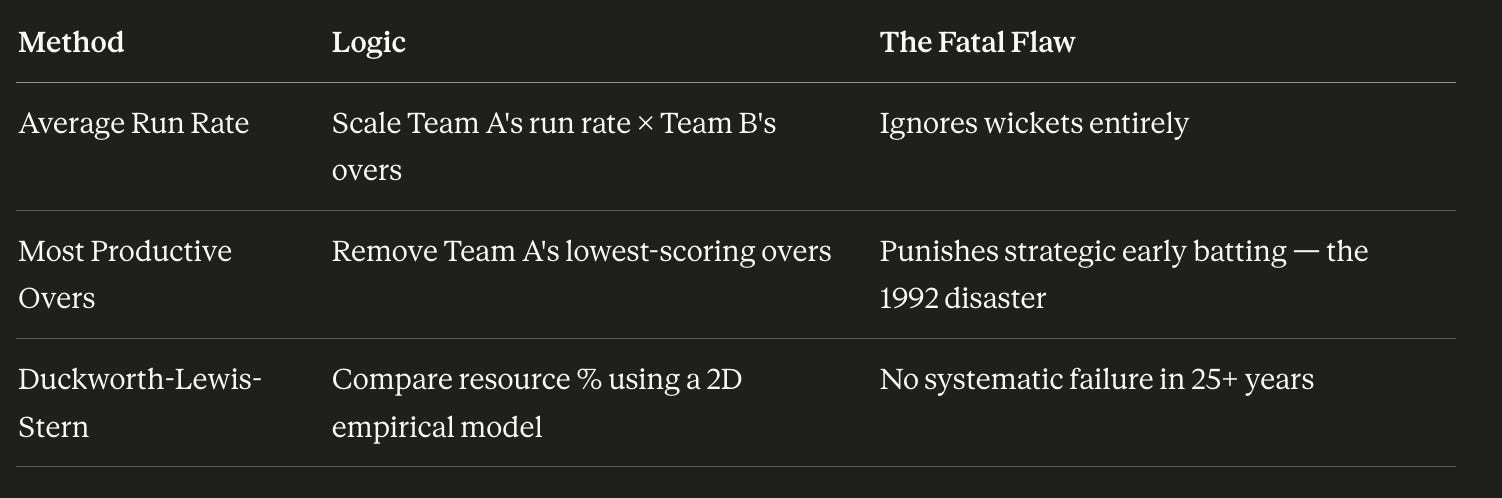
Teams deliberately score slowly early to preserve wickets. MPO removed those “low-scoring” overs — but those were the most strategically valuable ones. It had no way to understand that.
Enter Duckworth and Lewis
Frank Duckworth was a retired statistician, Tony Lewis was a lecturer in quantitative methods at Oxford Brookes. Neither was a cricketer. They were two men who looked at the rain rule problem and thought: this is a statistics problem, not a cricket problem.
They met in the early 1990s and began asking a different question. Not “how do we adjust the target?” but:
“How do we measure what a team has left?”
This reframing changed everything. Once you measure the remaining batting potential of each team — as a percentage, accounting for both overs and wickets — the revised target almost calculates itself.
Their paper was published in the Journal of the Royal Statistical Society in 1997. The ICC adopted it in 1999. In 2014, Professor Steven Stern updated the parameters for the modern game (faster scoring, T20 formats), and it became Duckworth-Lewis-Stern (DLS) — the system used today.
The Core Idea — Resources
What “Resources” Actually Means
Think of a cricket innings as a bank account with two currencies — overs (time) and wickets (capital). At the start: 50 overs, 0 wickets lost = 100% resources.
The D/L model assigns a resource percentage to every possible combination of overs remaining and wickets lost. The same overs remaining means something completely different depending on wickets:
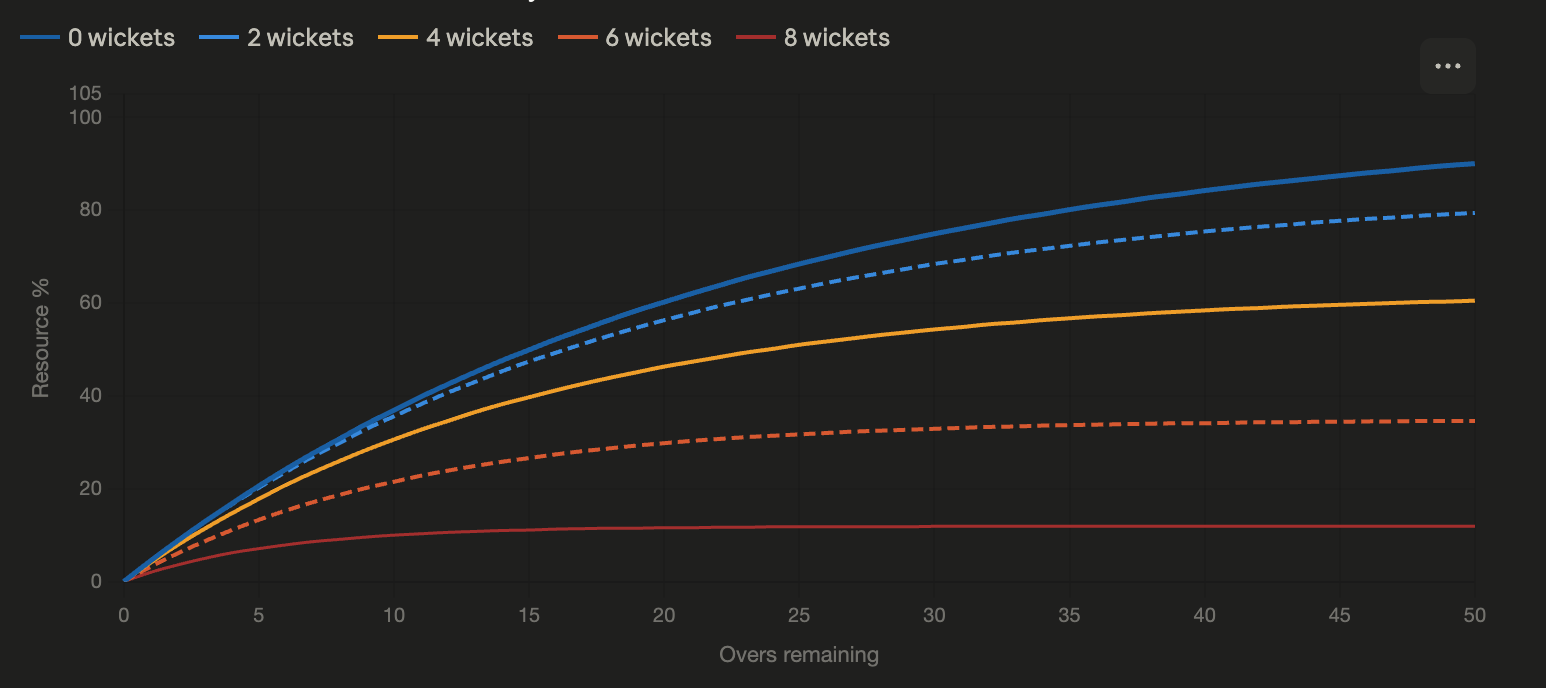
This chart makes the non-linearity vivid — each curve is a different wicket state:Notice the gaps between curves. The gap between 0 wickets and 6 wickets at 30 overs remaining is over 40 percentage points. Two teams with the same time left can be in radically different situations.
The Mathematics
The Resource Function
The heart of D/L is a formula that maps every (overs, wickets) combination to a resource percentage:
Z(u, w) = Z₀(w) × [1 − e^(−b(w) × u)]
In plain English:
u = overs remaining
w = wickets lost
Z₀(w) = the maximum you could ever score from this wicket state, even with infinite time — this shrinks as you lose more wickets
b(w) = how quickly resources build per over at this wicket state
e^(...) = the exponential shape — fast growth when overs are plentiful, slowing as they run out
Why Exponential?
Why does the exponential family fit cricket? Think about what actually happens in a real innings:
Early overs: Very high marginal value — you’re building a platform, powerplay rules favour batting, each over adds a lot.
Middle overs: Moderate value. Consolidation phase.
Death overs: High absolute run rate, but proportionally less marginal value because you’ve already used most of your resource.
This is exactly the shape of an exponential saturation curve — steep growth early, flattening later. The same shape as how a phone charges: fast at 10%, slow near 100%.
Crucially, Duckworth and Lewis did not assume this shape theoretically. They fitted it to data from thousands of real innings and found the exponential family minimised prediction error. The math followed the cricket, not the other way around.
This chart shows the marginal value of each over — how much resource each additional over adds, across wicket states:
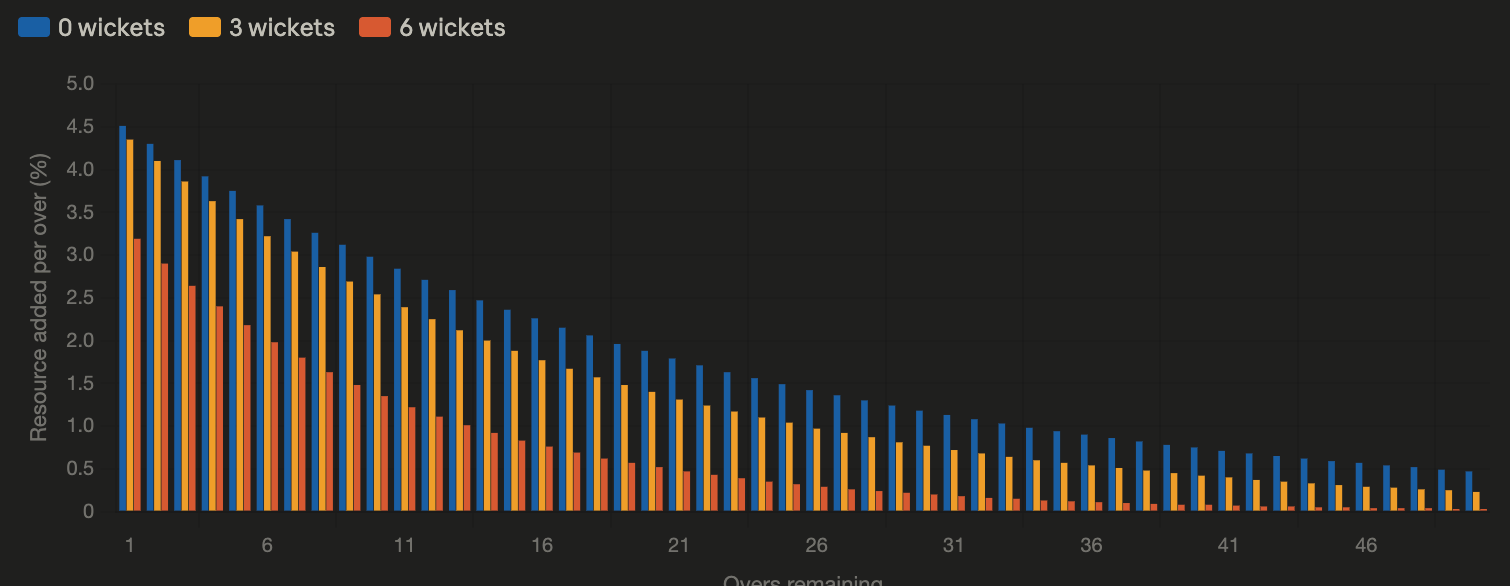
Each bar is one over’s contribution to total resources. The same over (say, over 15 remaining) contributes far more when you have wickets in hand — because a settled batting pair can fully exploit it. This is the exponential decay in action.
The DLS Update — When the Model Evolved
By the mid-2000s, cricket had changed. T20 exploded. Average ODI scores rose significantly. The original D/L parameters had been fitted to 1970s–90s data — modern batsmen were scoring faster, especially in death overs.
Professor Steven Stern of Bond University recalibrated the model in 2014. He re-fitted the parameters to modern match data and adjusted how very short matches were handled. The structure was identical. The parameters were updated.
This is a clean product story: same architecture, new data, better outcomes. The team didn’t rebuild from scratch. They ran modern data through the existing framework and let the numbers update themselves.
What This Story Teaches Us
Five principles that outlast cricket:
1. Reframe the measurement. MPO asked “how do we adjust the score?” D/L asked “how do we measure what each team has?” The second question is the right one. In complex problems, the first breakthrough is often finding the right thing to measure.
2. Build models from data, not assumptions. The exponential function wasn’t derived from cricket theory — it was fitted to data from thousands of real innings. Build your models from observed reality.
3. Simple fails at the edges. Average Run Rate is simple. MPO is simple. Both fail catastrophically in the situations that matter most — high pressure, late-game, rain. Simple models applied to complex edge cases produce disasters.
4. Fair ≠ equal. D/L doesn’t give both teams the same target. It gives them a fair target given their actual situation. Equal is uniform treatment. Fair is contextually appropriate treatment. They are not the same thing.
5. Models need maintenance. D/L worked well from 1999 to 2014. Then cricket changed and the parameters needed updating — but the structure held. Build systems that can be recalibrated without being rebuilt.
The Final Word
When that interviewer asked me about Duckworth-Lewis, he wasn’t really asking about cricket. He was asking whether I understood how to think about fair resource allocation in a complex, interrupted, dynamic system.
The D/L method is a story about two people who looked at a broken system, reframed the problem, built a model from real data, and created something so well-designed it has survived 25+ years of one of the most analytically intense sports in the world.
That’s good problem-solving. That’s what it looks like to solve the right problem.
Thanks for reading. If you found this useful, share it with someone who loves cricket, data, or both.